This website is designed to explore genomic and transcriptomic dataset
from plant. We have collected publicly available
microarray and RNASeq datasets to perform Boolean analysis on
Arabidopsis thaliana.
How to cite
Pandey, S, Sahoo, D. Identification of gene expression logical invariants in
Arabidopsis. Plant Direct. 2019; 3: 1– 9.
https://doi.org/10.1002/pld3.123
Tutorial
The Home link above will take you to the home page where there are links to two
different tools to explore Arabidopsis thaliana datasets.
The About link above will take you to this page again.
The Contacts link above will take you to a page
with information about the authors and contributors.
In the Home page there are links to following two
different tools:
- HEGEMON scatterplot explorer
- HEGEMON annotation browser
HEGEMON scatterplot explorer links are identified by the following links in the
Home page:
- Explore Arabidopsis thaliana data
- Explore scatterplots between FRU (AT2G28160) and AP3 (AT3G54340) in Microarray data
- Explore scatterplots between FRU (AT2G28160) and AP3 (AT3G54340) in RNASeq data
HEGEMON annotation browser links are identified by "Plant microarray annotation
browser (Click here to get access)" under the heading "Annotation Browser".
HEGEMON scatterplot explorer
When you click the "Explore" link you will see a page like below:

- Select Dataset: select a dataset to analyze by using the dropdown menu.
- topGenes: This button click lists top nG (you can enter a number in the textbox) differentially expressed genes (default 10).
- Gene A: Type a gene name in the textbox (Gene Symbol Name, Affymetrix ID or AGI code AT#G#####). Gene A is used in the X-axis of the scatterplot.
- Gene B: Type another gene name in the textbox (Gene Symbol Name, Affymetrix ID or AGI code AT#G#####). Gene B is used in the Y-axis of the scatterplot.
- getIDs: Lists the probe IDs present in the selected dataset. Click on
this button to make sure that a probe exists in the dataset.
- getPlots: Shows scatterplots with all combinations of the probe IDs
between gene A and gene B. At this page the users can select their favorite
scatterplots by clicking mouse in the middle of the scatterplot. Once a
scatterplot is selected textboxes corresponding to
Gene A and Gene B are changed to reflect
the selection.
- getStats: Shows scatterplots and various statistics
with all combinations of the probe IDs
between gene A and gene B. For each scatterplot a statistical test was
performed to check if there is a Boolean implication relationship between Gene A and B. At this page the users can select their favorite
scatterplots by clicking mouse in the middle of the scatterplot. Once a
scatterplot is selected textboxes corresponding to
Gene A and Gene B are changed to reflect
the selection similar to getPlots.
- Explore: Shows the selected scatterplot with a new set of tools on the
right.

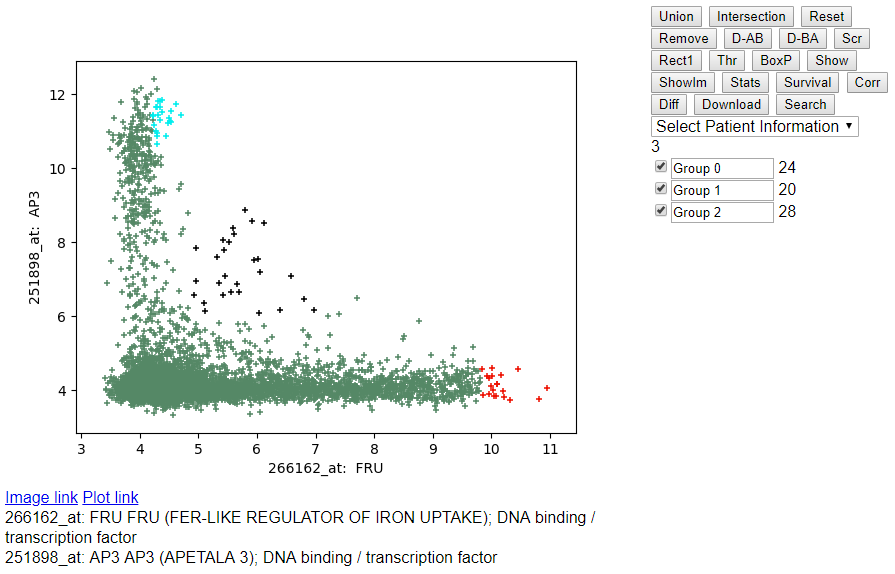
- Selecting samples using Mouse

- Highlighting the samples using the checkbox on the left side of
"Group 0".

- Highlighting multiple groups using the checkbox on the left side of
"Group 0", "Group 1", "Group 2".
- Extracting the GEO links to the experiments: Select the checkbox on
the left of "Group 0" and click on the button "Show" above.

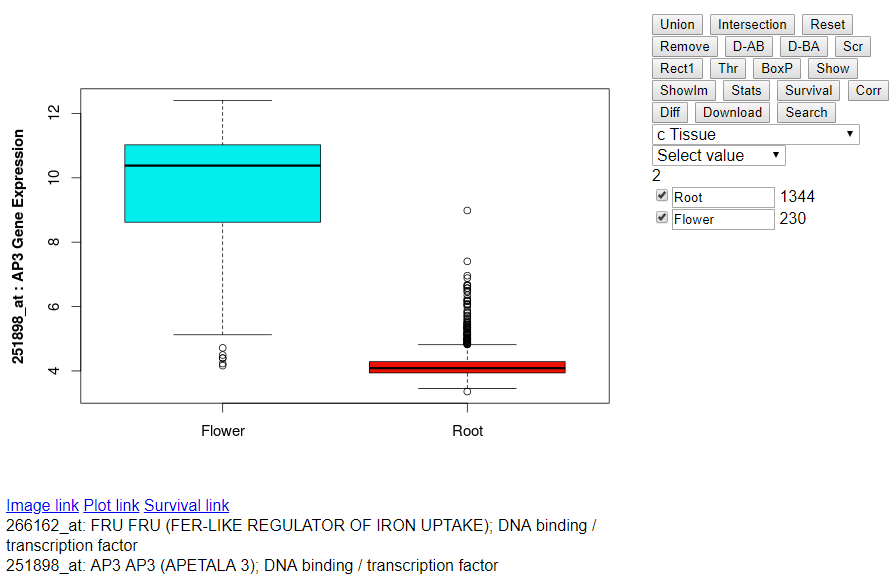
- Selecting Tissue Annotation: Click on the drop down menu "Select
Patient Information" and select "c Tissue".

- Selecting Root Samples: Click on the drop down menu "root" after selecting Tissue annotation above.
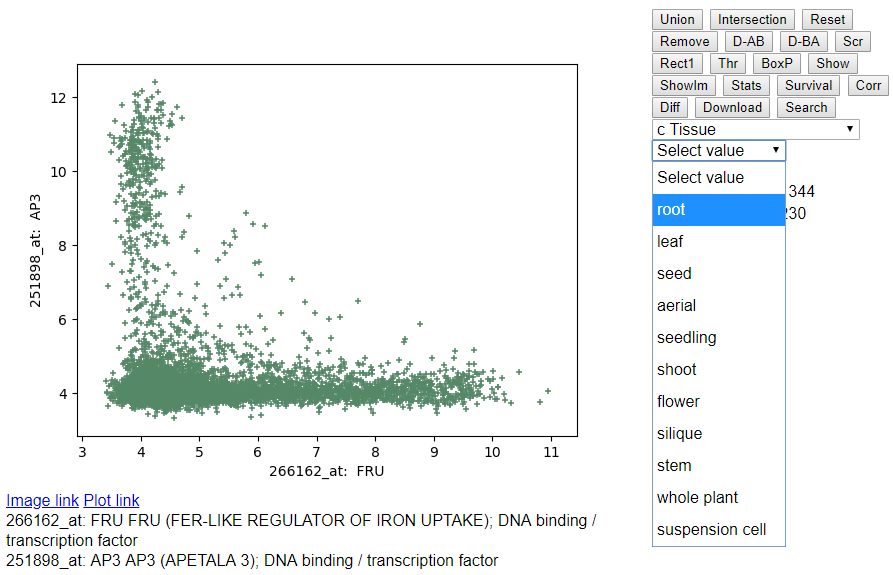
- Selecting Flower Samples: Click on the drop down menu "flower" after
selecting root samples above.

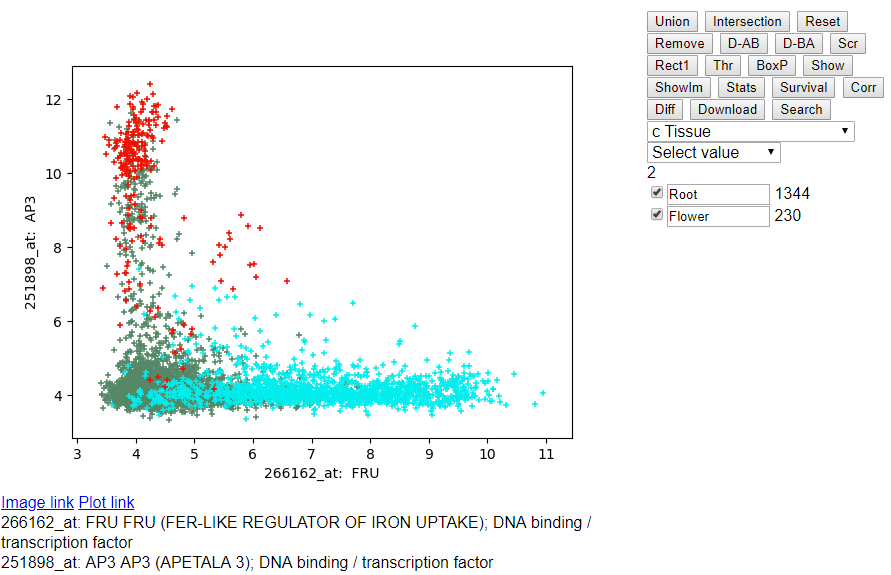
- Highlighting Root and Flower Samples: You can change the names of the
respective groups "Group 0" to "Root" and "Group 1" to "Flower". Click
on the checkbox to highlight them in the scatterplot.
- Boxplot of Root and Flower Samples: After selecting the checkbox on
the left side of "Root" and "Flower" click on the button "BoxP" above.
- Download scatterplots, boxplots and results of different statistical tests: After selecting the checkbox on the left side of "Root" and "Flower" click on the button "Download" above. It opens a new page with a pdf file:
Hegemon-plots .
HEGEMON Annotation browser
Comming Soon!! Please check back later.
Software
Data
GSE118579 - Identification of gene expression logical invariants in Arabidopsis
Acknowledgement
Dr. Debashis Sahoo is supported by startup funds from the Department of Pediatrics at University of California San Diego, and a R00 grant from National Institute of Health, USA (R00CA151673).